Abstract
This chapter explores the mathematical modeling of gene regulatory networks, focusing on both negative and positive feedback mechanisms through the lens of the tryptophan and tryptophanase operons. We develop ordinary differential equations to capture the dynamics of gene expression, enzyme activity, and metabolite synthesis, revealing the underlying feedback mechanisms that govern these processes. The tryptophan operon exemplifies a system characterized by redundant negative feedback regulation, highlighting the roles of transcriptional attenuation and repression in maintaining homeostasis and enabling rapid responses to environmental changes. In contrast, the tryptophanase operon showcases positive feedback regulation, demonstrating how such mechanisms can lead to bistability under specific conditions. This bistable behavior allows for toggling between distinct expression states, enhancing the operon’s adaptability in fluctuating environments. Overall, our findings underscore the intricate interplay between feedback regulation and gene expression, emphasizing their critical roles in bacterial survival and resilience.
Introduction
Gene regulatory networks control cellular behaviour through feedback acting at transcriptional and enzymatic levels. In this chapter we develop simple ordinary differential equation models that capture the core dynamics of operons involved in tryptophan metabolism, using Hill-type regulatory functions and quasi-steady-state reductions to make analysis tractable.
We study two complementary case studies. The first, the tryptophan (trp) operon, exemplifies layered negative feedback—repression, transcriptional attenuation, and allosteric enzyme inhibition—and illustrates how redundancy shapes stability and response times. The second, the tryptophanase (tna) operon, features positive feedback and can exhibit bistability, explaining how heterogeneous expression and bet‑hedging arise in bacterial populations.
Our goal is to link mathematical behavior (steady states, stability, bifurcations, and timescales) to biological function and intuition, and to provide exercises that let the reader explore these phenomena analytically and numerically.
General Model Development
Gene expression is a complex process involving numerous chemical reactions at each step of transcription and translation. However, we can build a simple model based on the central dogma of molecular biology.
Consider a basic operon whose genes code for an enzyme that catalyzes the synthesis of a metabolite . The synthesis of the operon’s mRNA, , via transcription is feedback-regulated by . Additionally, the activity of the enzymes may also be feedback-regulated by . With these considerations, the dynamics of , , and are governed by the following ordinary differential equations (ODEs):
Here, represents the maximum transcription initiation rate, is the rate constant for mRNA degradation, denotes the translation initiation rate, is the rate constant for enzyme degradation, is the maximum metabolite synthesis rate per enzyme molecule, and is the rate constant for metabolite degradation. The functions and denote feedback regulation in terms of metabolite concentration. can be interpreted as the probability that the promoter is not repressed, while represents the fraction of un-inhibited enzyme molecules. These functions are decreasing (increasing) functions of in case of negative (positive) feedback regulation.
The functions and take values in the interval as they can be understood as probabilities. is the probability that the mRNA polymerase binding site is not blocked by a repressor molecule, which depends on the amount of active repressor molecules. Depending on the system, repressor molecules are active when they are free from or bound by specific metabolites. In summary, transcriptional repression can be reduced to a, more or less intricate, ligand-receptor interaction. Thus, based on the results in Chapter 25, the function can be approximated by a growing or decreasing Hill function, depending on whether it accounts for positive or negative feedback regulation:
In the equation above, is the half-saturation constant (), and is the so-called Hill exponent. It measures the sigmoidicity of the Hill function. When , the function becomes a Michaelis-Menten equation, whereas it approaches a step function when . The sign () is chosen to account for negative (positive) regulation.
Enzymes are often inhibited or activated when they are bound by specific metabolites. Thus, enzyme inhibition can also be reduced to a ligand-receptor problem, and the function can be approximated by a Hill function:
The Tryptophan Operon
A specific model for the tryptophan operon, discussed in the previous chapter, can be derived from our general model as follows:
with
In these equations, represents the intracellular concentration of tryptophan, the amino acid produced by the tryptophan operon. denotes the concentration of the enzyme anthranilate synthase, a tetrameric protein composed of two peptides resulting from the expression of the first gene (trpE) and two peptides from the second gene (trpD) of the tryptophan operon. Anthranilate synthase catalyzes the rate-limiting step in tryptophan biosynthesis, and its activity is feedback-regulated by the end product, tryptophan.
The first equation describes the dynamics of mRNA concentration, where is the maximum rate of mRNA synthesis, is the half-saturation constant for tryptophan’s negative feedback on gene transcription, and is the Hill coefficient governing the cooperativity of this feedback regulation.
The second equation models anthranilate synthase dynamics. is the enzyme synthesis rate per mRNA molecule and is the rate constant for enzyme degradation.
The third equation models the dynamics of tryptophan concentration, where is the maximum rate of tryptophan synthesis, is the half-saturation constant for tryptophan’s negative feedback on its own synthesis, is the corresponding Hill coefficient, and is the rate constant for tryptophan degradation or consumption.
This model captures the essential features of the tryptophan operon, including the multi-layered negative feedback regulation mechanisms employed to control tryptophan biosynthesis. Firstly, the transcription of the operon is negatively regulated by tryptophan through two distinct mechanisms: repression and transcriptional attenuation, both of which are accounted for by a single regulatory function. Secondly, the activity of the key enzyme anthranilate synthase is directly inhibited by tryptophan through allosteric regulation.
One of the first questions that arises is the reason for redundant negative feedback mechanisms in the tryptophan operon system. We address this question by analyzing the stability of the system’s steady states. But first, it convenient to simplify the model.
According to Santillán & Zeron (2004), the half-life of mRNA is about one minute, while that of anthranilate synthase is a few hours, and that of tryptophan is a few seconds. This suggests that mRNA and tryptophan have much faster dynamics than anthranilate synthase. Therefore, we can make quasi-steady-state approximations for and .
From the condition , we get:
On the other hand, the condition implies:
Since is a continuous decreasing function of , representing the negative feedback regulation of enzyme activity by tryptophan, is a continuous growing function that can be inverted to give:
Substituting Eqs. (6) and (8) into the equation for (Eq. (4)), we obtain a reduced model that ignores the rapid transients of and and focuses on the slow dynamics of :
The value of at the steady states can be computed from the condition , which yields:
The left-hand side of this equation is the 45-degree diagonal straight line, while the right-hand side is a continuously decreasing function of that is greater than zero at . It can be proven from these facts that the two curves intersect at a single point, implying that our model has only one steady state given by the solution of Eq. (10). The steady-state values of and can then be obtained by substituting the stationary value of into Eqs. (6) and (8), respectively.
The stability of the steady state is determined by the derivative of the right-hand side of Eq. (9). After some algebraic manipulation, it can be shown that this derivative is given by the following expression:
where
is the theoretical upper bound for the intracellular tryptophan concentration.
Note that since , implying that the steady state is locally stable. On the other hand, is the upper bound of , which is achieved when . This indicates that transcriptional regulation plays a fundamental role in accelerating the system’s response after a perturbation from the steady state. Notably, repression and transcriptional attenuation achieve maximal sensitivity at quite different tryptophan levels; repression at about and transcriptional attenuation one order of magnitude below Santillán & Zeron (2004). This may ensure a rapid response over a wide range of tryptophan concentrations.
Regarding enzyme inhibition, observe in Eq. (11) that increases (becomes less negative) as decreases (becomes more negative). Thus, this regulatory mechanism slows down the system’s long term response instead of accelerating it. Interestingly, the dissociation constant for the binding of tryptophan to anthranilate synthase is one order of magnitude smaller than , implying that because enzyme inhibition is in the saturation regime at the steady state Santillán & Zeron (2004). This indicates that enzyme inhibition facilitates a rapid transient response; by reactivating inhibited enzymes when tryptophan levels plummet, the system bypasses the lag of de novo protein synthesis. While this mechanism effectively pulls the system away from a critical state, it does not interfere with the gradual progression toward a steady state, which remains governed by transcriptional regulation.
To better appreciate the dynamic effects of enzyme inhibition, we can exploit the separation of timescales by treating the enzyme concentration, , as a constant in the differential equation for tryptophan, :
This yields a one-dimensional dynamical system where the quasi-steady states are determined by the solutions to:
Because the left-hand side, , is a positive-defined monotonically-decreasing function of and the right-hand side is a growing linear function passing through the origin, the equation yields a unique quasi-steady state, .
Furthermore, the stability of this fixed point is determined by the slope of the ODE right-hand side:
Since is negative and is positive, the slope is negative and the fixed point is locally stable. Notably, a more negative implies a faster convergence of this reduced system toward the quasi-steady state . However, for the complete system to reach its global equilibrium, must reach its fixed-point value—a process governed by the slower kinetics of transcriptional regulation.
The Tryptophanase Operon
A simple mathematical model that captures the key regulatory features of the tryptophanase operon can be written as follows:
In these equations, denotes the level of the tryptophanase operon proteins (TnaA and TnaB), while represents the intracellular tryptophan concentration. The parameter is the maximum transcription rate of the operon, which is negatively regulated by external glucose via catabolite repression. The Hill function accounts for the positive regulation of transcription by intracellular tryptophan (mediated by inactivation of the terminator). The term represents protein degradation and dilution due to cell growth. The rate of tryptophan uptake is given by , where is an increasing function of the external tryptophan level , reflecting the role of TnaB as a tryptophan permease. The term is the rate at which intracellular tryptophan is metabolized by the TnaA enzyme. Finally, accounts for tryptophan consumption by other processes like protein synthesis and dilution by growth.
To simplify the analysis, we assume the tryptophan metabolism flux is much smaller than the other tryptophan consumption terms (). This yields the reduced model:
By introducing the dimensionless variables , , , and defining , , the model becomes:
Note that increases with (repressing operon expression) and decreases with (enhancing expression).
To find steady states, we set , yielding:
Thus, the steady-state values of satisfy:
Graphical analysis (Fig. Figure 1) reveals that for large , this equation has a single solution (no expression). As decreases, two additional steady states emerge via a saddle-node bifurcation: an intermediate state and a high expression state near .
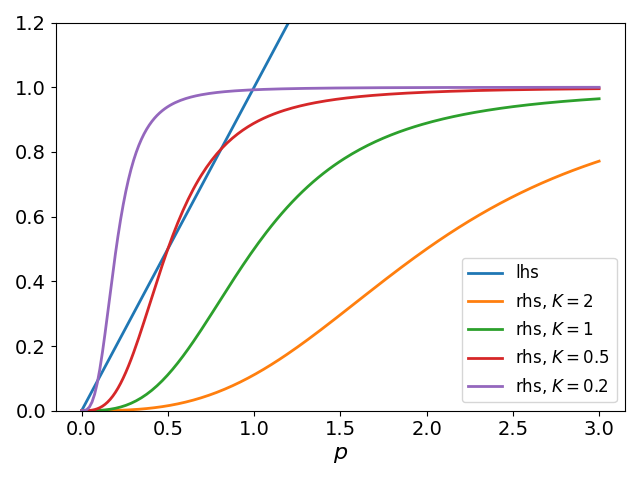
Figure 1:Intersection of the identity line and Hill functions () varying .
To study stability, we compute the Jacobian matrix:
where is the derivative of the Hill function. The trace is negative, while the determinant is . zThus, a steady state is stable if , i.e. at the steady state . Since the sigmoidal curve has a slope less than 1 at the low and high stable states, these are stable nodes. However, the intermediate state has , making it an unstable saddle point.
In summary, the tryptophanase operon can exhibit bistable expression dynamics when tryptophan and glucose levels permit it. In bacterial populations, gene expression is not uniform; instead, it exhibits a phenomenon known as biochemical noise. In the presence of bistability, this variability can lead to some individual bacteria expressing genes at low rates (corresponding to the low-expression steady state) while others express them at high rates (corresponding to the high expression steady state). This heterogeneity can be particularly advantageous for bacterial populations facing rapidly changing environments as it can facilitate a form of bet-hedging, where the population as a whole can respond more flexibly to environmental shifts. For instance, if a sudden change in the environment favors a particular metabolic pathway, those bacteria with higher expression levels of the relevant genes are more likely to thrive. At the same time, the presence of low-expressing cells ensures that not all members are similarly affected by deleterious environmental changes, thereby providing a reservoir of potential adaptability. This dynamic interplay of expression levels, driven by biochemical noise, underscores the importance of gene regulatory networks, such as the tryptophanase operon, in enabling bacterial populations to swiftly adapt to their surroundings.
Discussion
In this chapter, we have delved into the mathematical modeling of gene regulatory networks, particularly focusing on two key feedback regulatory motifs: negative and positive feedback regulation, using the tryptophan and tryptophanase operons as representative examples.
Through the development of ordinary differential equations, we have captured the dynamics of gene expression, enzyme activity, and metabolite synthesis, shedding light on the origins of the feedback mechanisms that govern these processes.
The tryptophan operon serves as a prototypical example of gene networks characterized by redundant negative feedback regulation. Our analysis revealed the critical roles of transcriptional attenuation and repression in maintaining homeostasis while facilitating rapid responses to environmental changes. Interestingly, while allosteric enzyme inhibition does not accelerate system responses, it enhances the energetic efficiency of tryptophan biosynthesis.
In contrast, we examined the tryptophanase operon as an example of gene expression influenced by positive feedback regulation. We demonstrated that this positive regulation can lead to the emergence of bistability under certain conditions. This bistable behavior underscores the operon’s capacity to toggle between distinct expression states, providing a robust mechanism for adaptation in fluctuating environments.
Overall, our exploration of these operons highlights the intricate interplay between feedback mechanisms and gene expression, emphasizing their significance in bacterial adaptation and resilience.
Exercises
Consider the following toy model of a gene regulatory network subject to negative feedback regulation:
Here, represents the concentration of a protein, is a positive constant standing for the sensitivity of the feedback regulation to , and is a positive Hill exponent. Analyze the steady states of the system and determine their stability properties. Particularly, investigate the effect of on the relaxation times associated with the system’s response to perturbations.
Consider the following toy model of a gene regulatory network subject to positive feedback regulation:
Here, represents the concentration of a protein, is a positive constant standing for the sensitivity of the feedback regulation to , and is a positive Hill exponent. Analyze the steady states of the system and determine their stability properties. Analyze the steady states of the system and determine their stability properties. In particular, investigate the influence of the Hill exponent on the number and stability of the steady states, as well as the relaxation times associated with the stable states.
- Santillán, M., & Zeron, E. S. (2004). Dynamic influence of feedback enzyme inhibition and transcription attenuation on the tryptophan operon response to nutritional shifts. Journal of Theoretical Biology, 231(2), 287–298. 10.1016/j.jtbi.2004.06.023